International Journal of Theoretical and Applied Nanotechnology (IJTAN)
ISSN: 1929-1248

Volume 5 - Year 2017 - Pages 1-7
DOI: 10.11159/ijtan.2017.001
Structural Study of SrTiO3 Doped with Mn Using X-Ray Diffraction
Zainab Ibrahim Booq, Sara Khalid Alghaith
Science College of King Saud University, Department of Physics and Astronomy
Turky Alaual, Riyadh, middle, Saudi Arabia, 11451
Zbooq@ksu.edu.sa; S.al_ghaith@hotmail.com
Abstract - Monocrystalline Mn:SrTiO3
was prepared from the compounds MnO2, TiO2, and SrCO3,
which had equivalent weights of 2.52 g. Mn was doped in this sample at 60 mol%.
The sample was heated half hour, and annealed at 1223 K ( 950 °C ). The sample
had an orientation of (100). The study was performed at room temperature ( T =
300 K = 27 °C ). The structure of this crystal was investigated using X-ray
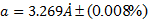
diffraction and found to be cubic (![]() ). The lattice parameter of the Mn:SrTiO3
crystal was 3.269 Å. The grain size of this crystal was magnified 5,000–100,000
times using scanning electron microscopy and found to be in range of 1.33µm – 91.4nm.
). The lattice parameter of the Mn:SrTiO3
crystal was 3.269 Å. The grain size of this crystal was magnified 5,000–100,000
times using scanning electron microscopy and found to be in range of 1.33µm – 91.4nm.
Keywords: Spectrum, grain, crystal structure factor, atomic scattering factor, annealing
© Copyright 2017 Authors - This is an Open Access article published under the Creative Commons Attribution License terms. Unrestricted use, distribution, and reproduction in any medium are permitted, provided the original work is properly cited.
Date Received: 2016-05-31
Date Accepted: 2015-11-22
Date Published: 2017-07-14
1. Introduction
Strontium titanate oxide ( SrTiO3
or STO ) crystal is a perovskite oxide material
( ABO3, where A is the rare earth element, B is the titanate, and O3
is the oxide ) [1]. This group of materials has a wide range of applications,
including uses in transistors, receivers, and non-vital memory devices [2]. It
is a semiconductor material [3], but becomes a superconductor when doped with
Mn or any other transition metal ion [4, 2, 5]. This characteristic is
responsible for the development of numerous physical properties, including good
conductivity and magnetic properties [4, 6].
It is worth mentioning that the
preparation methods for most ABO3 crystals are very similar. Several
preparation techniques have been developed to produce Mn:SrTiO3
nanoparticles, including a sol–gel method, organic precursor method [7], powder
sample
method [8], and solution method at high temperatures [4, 8, 9, 10].
In this study, a monocrystalline sample of Mn:SrTiO3 was prepared using a solution method at a high temperature, where Mn was used to dope the SrTiO3 crystal [4, 8, 9, 10]. Then, X-ray diffraction (XRD) was used to investigate the structure. This was the first study to investigate the structure of this crystal using a low-resolution XRD device with a maximum current intensity was I = 1 mA and voltage V = 25 kV. The grain size was determined using scanning electron microscopy (SEM). The crystal preparation was complicated because available literature is not sufficiently clear, and there are different methods for doping the crystal and annealing at high temperatures, which requires a special furnace. In addition, special skill is required to adapt the low-resolution XRD device.
2. Material and Methods
2.1. Preparation of Mn:SrTiO3 Monocrystal
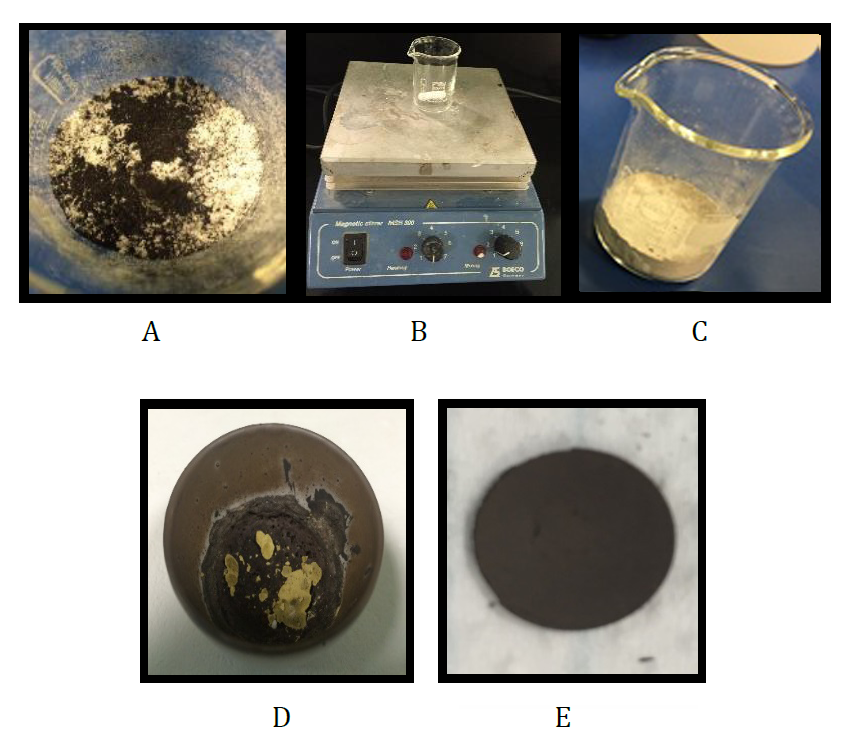
The Mn:SrTiO3 monocrystal was prepared using powders of MnO2, TiO2, and SrCO3 [4, 8, 9, 10] with purities of 70%, 99%, and 98%, respectively. These compounds were added by equal weights of 2.52. g of each of the compounds were used [8] , so that SrTiO3 was heavily doped by Mn at 60 mol%. The powders were mixed under magnetic stirring for 1 h to obtain a homogenous mixture. Then, the mixture was soaked in de-ionized (DI) water for 20–25 min [11, 12]. A 3:1 by volume HCL:HNO3 acidic solution was added and mixed for 12 min [13, 12]. The sample was annealed by being heated in a furnace at atmospheric pressure and temperature up to 1223 K ( 950 °C ) over a period of half hour, and then cold [11, 14, 4]. It was then ground and pressed [24, 15, 16] to form a pellet with a thickness of 3 mm and diameter of 12 mm. Thus, the monocrystal was formed. The surface of this pellet was purified using acetone [2]. The steps for preparing the monocrystal are shown in figure (1).
2.2. Study Methods
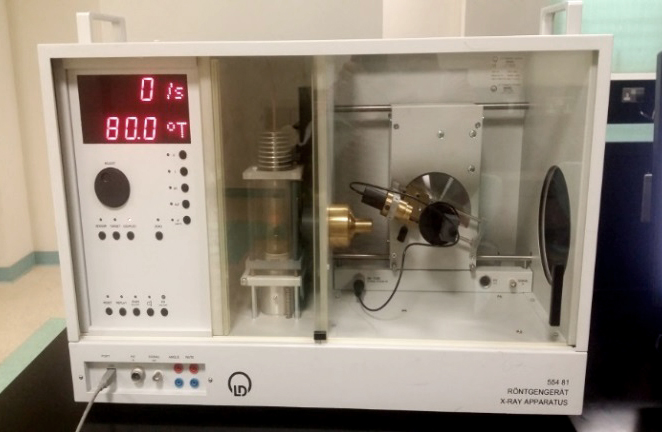
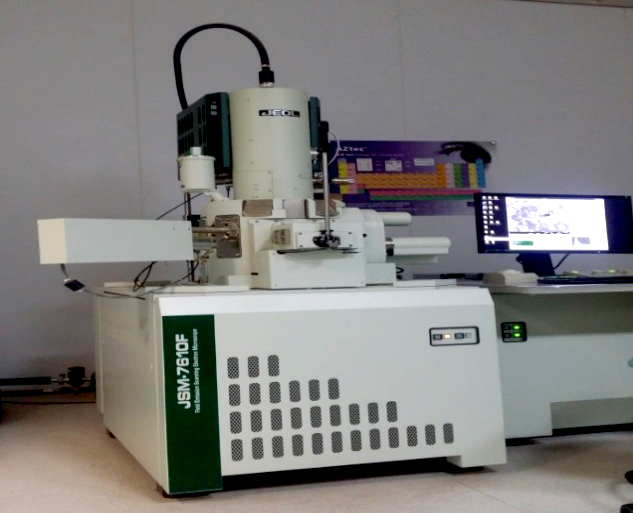
XRD was used to study the structure of this monocrystal by a low-resolution device ( X-ray apparatus 55481 ) with a molybdenum anode, maximum current intensity I = 1 mA, and voltage V = 20 kV [17], as shown in fig (2, A). The monocrystal was polished using platinum materials, and then SEM ( JSN-7610 ) was used to determine its grain size, as shown in figure (2, B).
3. Results and Discussions
3.1. Structural Study using XRD
The best spectrum of this monocrystal was obtained in several steps. In the first step, the voltage was varied ( V = 10, 15, 20, and 25 kV ), while the current intensity was fixed at I = 1 mA, as shown in figure (2). From this figure, it is clear that at a high voltage, the deformation in the shape of the spectral lines is duplicated in some parts of the spectra more than in the others. This indicates a large electron emission from the cathode to the anode, which made it difficult to investigate the number of reflection planes. At a low voltage, it should be noted that the spectrum has a small number of lines. In other words, the number of reflection planes in the crystal decreased because there were several electrons in the cathode that could not gain enough energy to arrive at the anode. For this reason, the X-rays coming from the source were very weak, which made it difficult to see the full crystal [17]. As seen in figure (3), the best spectrum of this monocrystal was clearly found at a voltage V = 20 kV, and the number of reflection planes (lines) agrees with the other results [9]. The sample was grown in the direction of the [100] plane, based on a calculation for the axial axis.

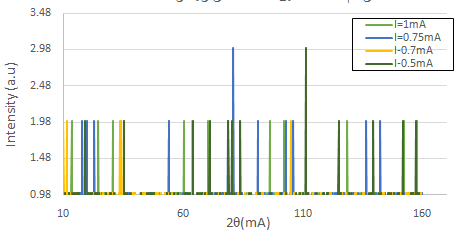
The second step involved varying the current intensity ( I = 0.5, 0.7, 0.75, and 1 mA ), while fixing the voltage V = 20 kV, as shown in figure (4). At a low current intensity, the number of reflection planes decreased because the number of electrons emitted from the cathode and arriving at the anode was low, which prevented all of the planes in the crystal from being seen. The best spectrum lines found in this step were at I = 1 mA, which agreed with the number of lines reported in the literature [15, 18].
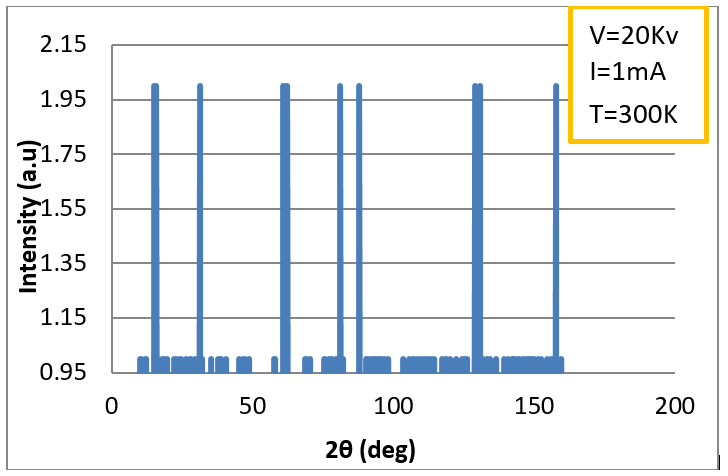
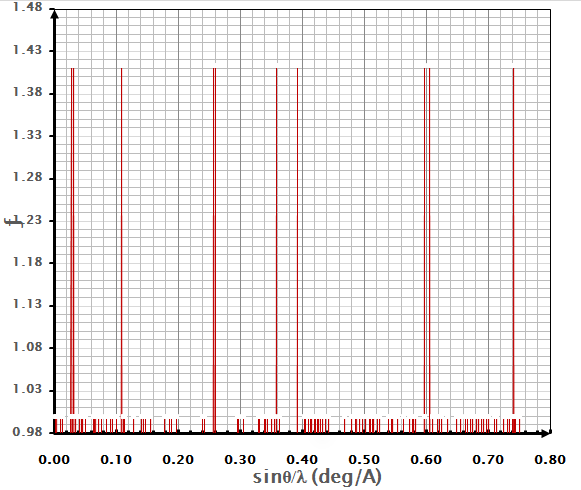
Finally, the best spectrum was
found for Mn:SrTiO3 at a current intensity I = 1 mA, voltage V = 20
kV, and
T = 300 K (27 0C), as shown in figure (5). It consisted of eleven
reflection planes, which agreed with the results of other studies [9, 18].
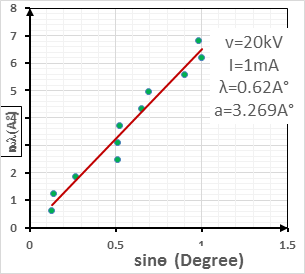
The X-ray wavelength of the best spectrum was calculated using equ. (1).

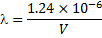

Where is wavelength, h is plank constant, e is electron charge and V is voltage. The lattice parameter (a), which was approximately equal to the distance (d) between the planes in the crystal, was calculated from the slope in figure (6) and Bragg's law (equ. (4)), as shown in the following equations [19]:


Where n the number of reflection planes, d is the distance between the reflection planes and a is the lattice parameter. The lattice constant value obtained from the experimental data was nearly the same as that found by others [8, 20, 9]. The reason for the very small differences between our lattice parameter result and that of others was the ratio of Mn doped in the STO, which was very high (heavily doped) in this study compared to others. If the doping in the crystal increased, the value of the lattice parameter decreased and vice versa [20].
The crystal structure factor was calculated from the atomic scattering factor (f) and spectrum intensity (R), as shown in equation (7) and figure (7) [19].

In equation (7) R is peak intensity, h, k, and L are the Miller indices in the x, y, and z directions, respectively. The atomic scattering factor (F) is constant in figure (6). Thus, the crystal structure factor (S) can be calculated using equ. (8) and figure (6). The crystal structure had a value equal to zero, as shown in equ. (10) [21].


Here, n is the number of atoms
in the molecule; u, v, and w are the cut parts along the x, y, and z axes,
respectively; and e is an exponential function. The structural factor was zero.
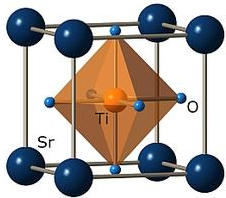
Thus, this crystal was cubic, of type (  ,as shown in figure
(8) [21, 22]. This result agreed with those of others [2, 21, 22], where Mn2+
substituted for Sr2+ and Mn4+ substituted for Ti4+
[23,1, 10, 24].
,as shown in figure
(8) [21, 22]. This result agreed with those of others [2, 21, 22], where Mn2+
substituted for Sr2+ and Mn4+ substituted for Ti4+
[23,1, 10, 24].
 ) [25].
3.2. Calculating Grain Size using SEM Technique
There are several techniques for elemental analyses at a specific location using SEM and transmission electron microscopy (TEM). SEM is used to analyze the surface and obtain information about the particle size, and TEM is used to determine the internal structure of a solid [26].
The grain size of this
monocrystal was calculated using SEM, as shown in figure (9), with a
magnification of 5,000 times. The grain size of the crystal was in the range of
1.33–1.39 µm when magnified 5,000 times, but it was in the range of 84.9–91.4
nm when magnified 100,000 times. The grain size changed with the level of
magnification [27]. This result agreed with those of others [7]. The grain size
of the crystal depended on the doping ratio of the crystal. If the doping ratio
of the crystal increased, the grain size decreased [20, 9].
Table (1) provides a brief summary of the results.
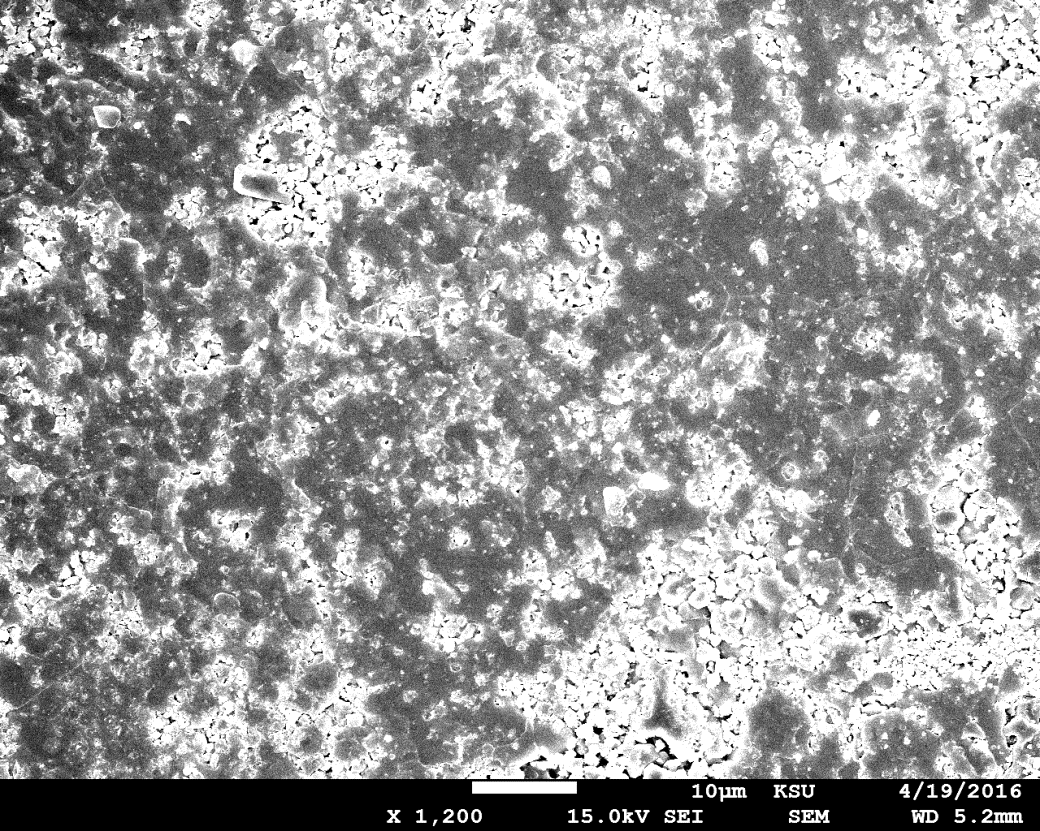
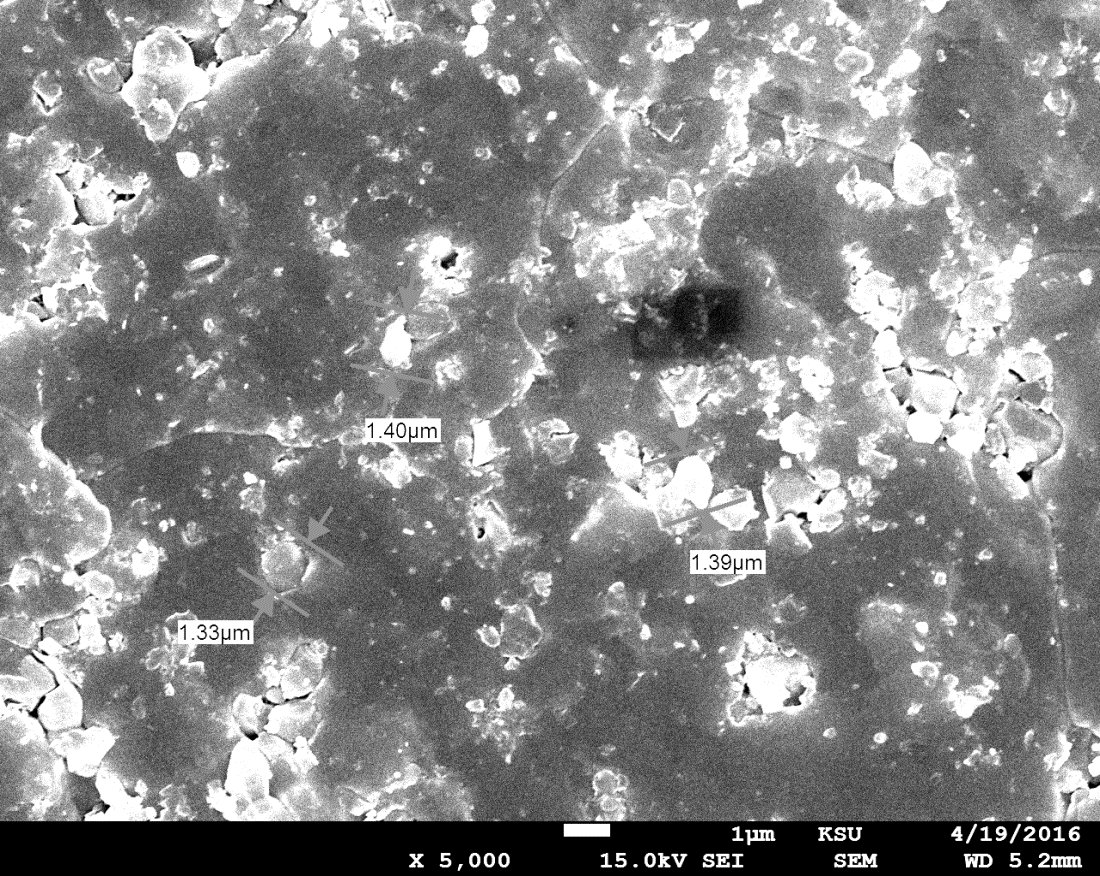
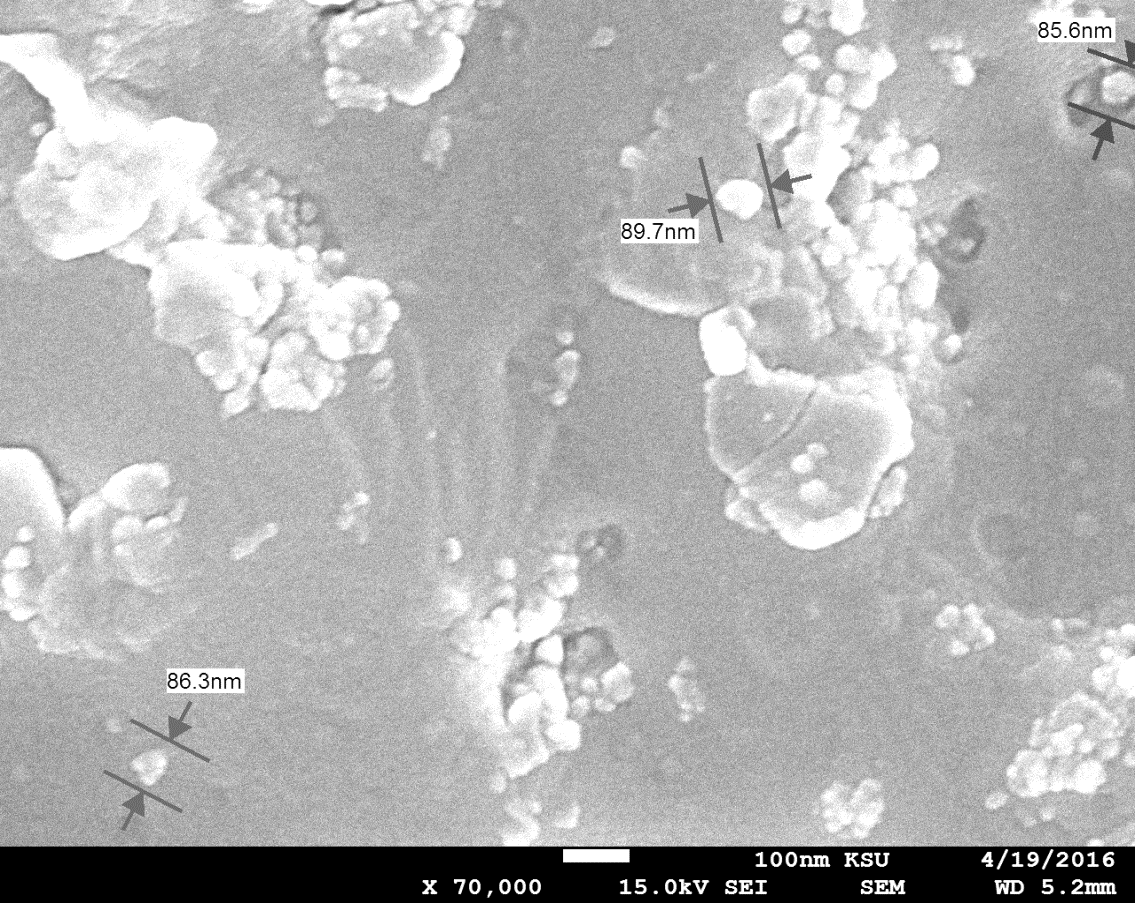
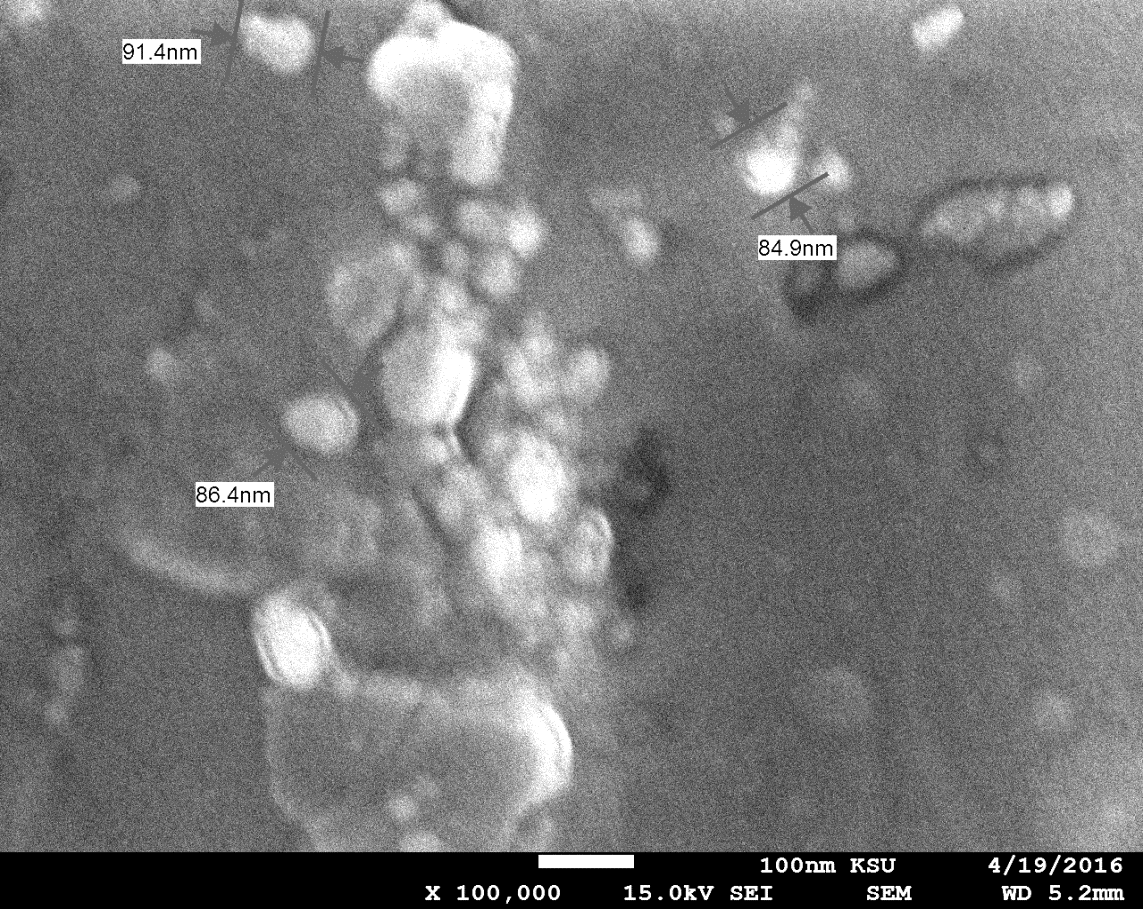
Table 1. Brief summary of results.
| Wavelength | l = 0.62 Å |
| Mn ratio in crystal | 60% mole percent |
| Sample size | thickness 3 mm diameter 12 mm |
| Annealing temperature | 1223 K = 950 °C |
| Crystal temperature Lattice parameter (a) | 300 K = 27 °C a = 3.269 Å |
| Crystal structure type | ( |
| Crystal grain size | 1.33 µm to 91.4 nm |
4. Conclusion
This was the first
structural study of Mn:SrTiO3 with 60 mol% of Mn doped in the STO.
It was investigated using a low-resolution XRD device, and the results obtained
were the same as those of a neutron diffraction study of STO doped with Mn. The
structure of this crystal was a cubic type ( ![]() )
in the direction of the [100] plane, and the lattice constant was 3.269 Å. The grain size was in
the range 1.39 µm –91.4 nm when magnified 5,000 to 100,000 times.
)
in the direction of the [100] plane, and the lattice constant was 3.269 Å. The grain size was in
the range 1.39 µm –91.4 nm when magnified 5,000 to 100,000 times.
5. Acknowledgment
The authors are very grateful for the help provided by the Research Center at King Saud University in calculating the crystal grain size using SEM. We would also like to thank the physics laboratory of solar energy and some colleagues (Aml, Hana, and Hajer) in the physics and chemistry departments, who assisted us in obtaining additional research facilities.
References
[1] F. M. F. De Groot, M. Grioni and et. al., "Strontium titanate," in Properties of strontium titanate, 2016, pp. 1-21.
[2] D. Choudhury, "Site-specific doping, tunable dielectric properties, and intrinsic paramagnetism in Mn-doped SrTiO3," Pramana J. Phys., vol. 84, no. 6, pp. 987-997, 2015. View Article
[3] M. D. Biegalski, D. D. Fong and et. al., "Critical thickness of high structural quality SrTi03 films grown on orthorhombic (101) DySc03," Journal of Applied Physics, vol. 104, pp. 114109, 2008. View Article
[4] T. Fix, F. Schoofs and et. al., "Influence of doping at the nanoscale at LaALO3:SrTiO3 interfaces," Appl. Phys. lett., pp. 072110-1072110-3, 2010. View Article
[5] L. P. Gor'kov, "Phonon mechanism in the most dilute superconductor: n type SrTiO3," in PNAS, Tallahassee, vol. 28, pp. 4646–4651, 2016. View Article
[6] M. C. Gallardo, A. I. Becerro and et. al., "Cubic–tetragonal phase transition in Ca0.04 Sr0.96 TiO3: A combined specific heat and neutron diffraction study," J. Phy. Condens. Matter, vol. 15, no. 2, pp. 91–100, 2002. View Article
[7] R. M. Mohamed, M. M. Rashad and et. al., "Structure and magnetic properties of nanocrystalline cobalt ferrite powders synthesized using organic acid precursor method," J. Magn. and Magn. Mat., vol. 322, no. 14, pp. 2058–2064, 2010. View Article
[8] C. B. Azzoni, M. C. Mozzati and et. al., "Magnetic investigation of Mn ions in La,Mn:SrTiO3" Solid State Communications, vol. 116, no. 6, pp. 303–308, 2000. View Article
[9] D. Choudhury, R. M. Goodbole and et. al., "Top polarization, forward-backward asymmetry, and new physics," Phys. Rev D., vol. 84, pp. 125–124, 2011. View Article
[10] D. Choudhury, S. Mukherjee and et. al., "Tuning of dielectric properties and magnetism of SrTiO3 by site-specific doping of Mn," A. B. Phys., vol. 53, pp. 5061–5069, 2005. View Article
[11] J. Choi, C. B. Eom and et. al., "Growth mode transition from layer by layer to step flow during the growth of heteroepitaxial SrRuO3 on (001) SrTiO3," Appl. Phys. Lett., vol. 79, no. 10, pp. 1449-1447, 2001. View Article
[12] M. Kareev, S. Prosandeev and et. al., "Atomic control and characterization of surface defect states of TiO2 terminated SrTiO3 single crystals," Appl. Phys. Lett., vol. 93, pp. 202-228, 2008. View Article
[13] J. Zhang, D. Doutt and e. al, "Depth-resolved subsurface defects in chemically etched SrTiO3," Appl. Phys. Lett., vol. 94, pp. 092904–092908, 2009. View Article
[14] A. Abadpour, "A sequential Bayesian alternative to the classical parallel fuzzy clustering model," Information Sciences, vol. 318, pp. 28–47, 2015. View Article
[15] A. M. Dehkordi, S. Bhattacharya and et. al., "New insights on the synthesis and electronic transport in bulk polycrystalline Pr-doped SrTiO3−δ," Journal of Applied Physics, vol. 117, pp. 055102, 2015. View Article
[16] M. S. J. Mashall and M. R. Castell, "Shape transitions of epitaxial islands during strained layer growth: Anatase TiO3(001) on SrTiO3(001)," Physical Review Letters, vol. 102, pp. 146-102, 2009. View Article
[17] L. D. Gmbtt. "Instruction sheet 554 82," Hurth, 2001.
[18] A. El-Sayed, "Influence of zinc content on some properties of Ni–Zn ferrites," Ceramics International, vol. 28, 2002, pp. 363–367. View Article
[19] H. Kooijman, "Interpretation of crystal struncture determinations," Bijvoet Center for Biomolecular Research, CH Utrecht, 2005. View Article
[20] C. Azzoni, M. C. Mozzati and e. al, "Magnetic evidence of different environments of manganese ions in Mn-substituted strontium titanate," Solid State Communications, vol. 114, no. 12, pp. 617–622, 2000. View Article
[21] M. Roessle, "Basic of x-ray scattering," EMBO course 2012, 2009.
[22] M. Huijben, A. Brinkman and e. al, "Structure-property relation of SrTiO3–LaAlO3 interfaces," Advanced Materials, vol. 21, no. 17, pp. 1665–1677, 2009. View Article
[23] F. R. Silly, M. Castell and e.al., "Bimodal growth of Au on SrTiO3_001," Physical Review Letters, vol. 96, no. 8, pp. 1–4, 2006. View Article
[24] A. Tkach, P. Vilarinho and e.al. "Structure–microstructure–dielectric tunability relationship in Mn-doped strontium titanate ceramics," Acta Materialia, vol. 53, no. 19, pp. 5061–5069, 2005. View Article
[25] Postnova. (2016). Centrifugal field-flow fractionation principle. [Online]. Available: http://www.postnova.com/centrifugal-fff.html?gclid=CMbNkZ6Tg88CFYUy0wodgoAMEg View Article
[26] T. Leisegang 1 , H. Stöcker, and e. al, “Switching Ti Valence in SrTiO3 by a dc Electric Field,” Phys. Rev. Lett., vol. 102, pp. 087601, 2009.View Article
[27] Deft Solid Solutions. (2016). Scanning & transmission electron microscopy. [Online]. Available: https://www.solids-solutions.com/rd/particle-sizing-and-particle-size-analysis/scanning-transmission-electron-microscopy/ View Article